SEARCH
  • There are no suggestions because the search field is empty.
NEWSLETTER

Sign-up to get the latest news and update information. Don't worry, we won't send spam!

Reporting & Dashboarding with board

Experience Corporate Performance Management with board

Licensing, consulting, implementation, training & support
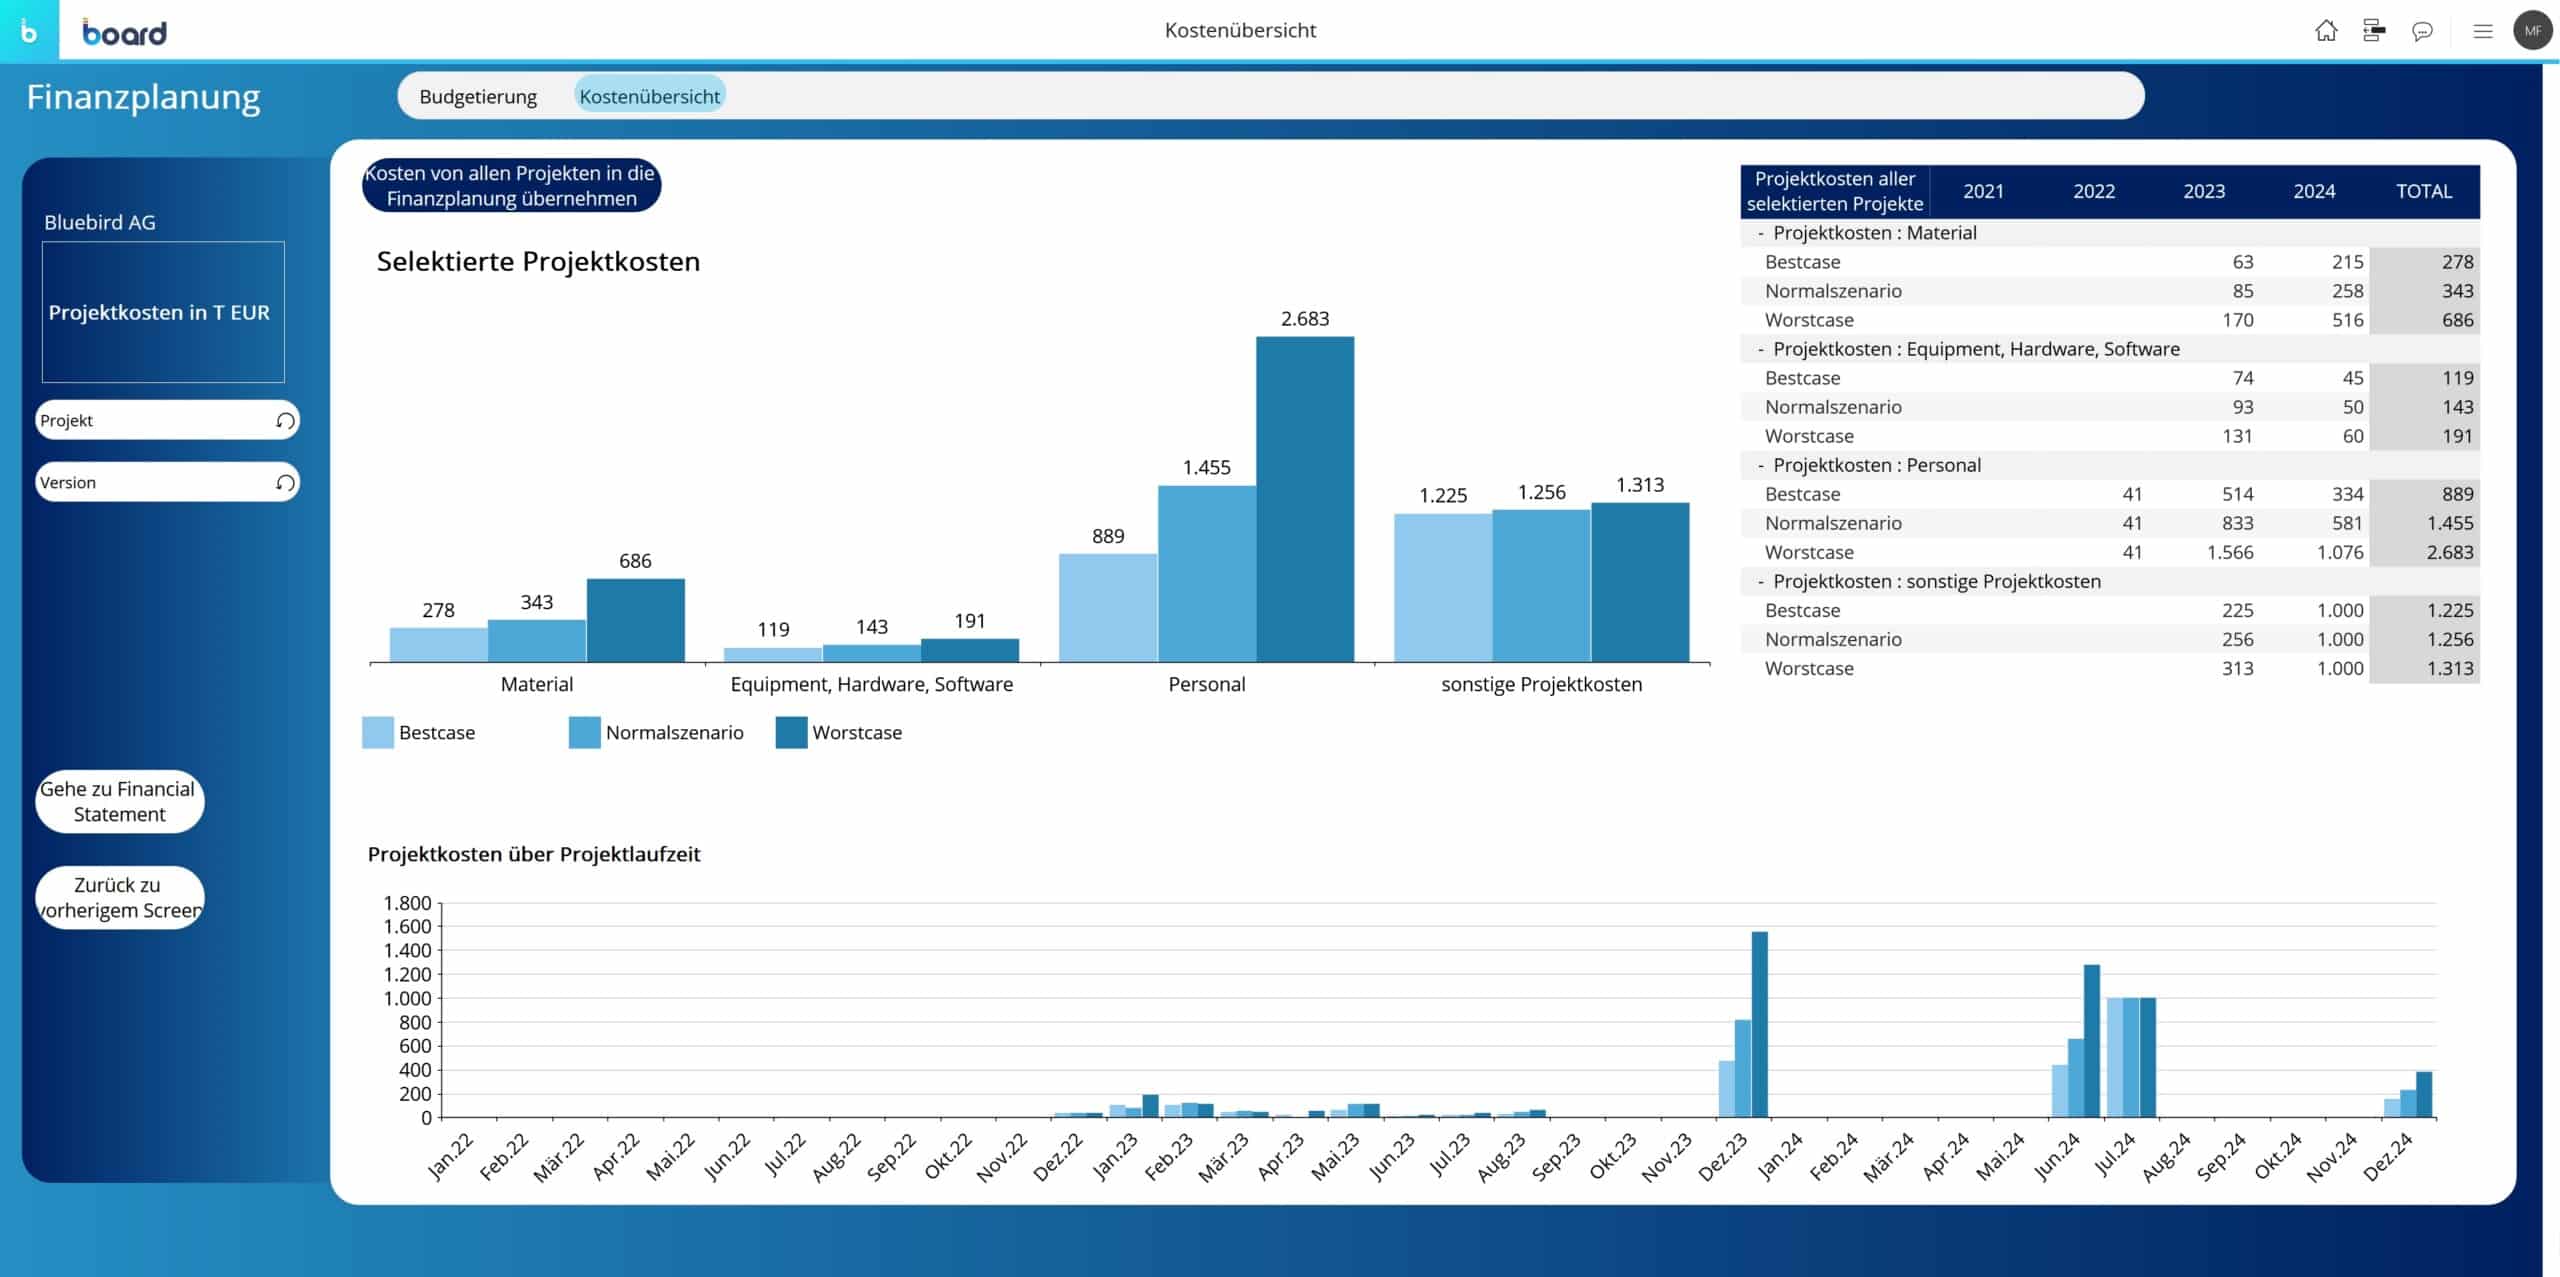
We are happy to advise you!
Notebook A screen shot of a dashboard with a blue background. The Bluebird website is displayed on a computer screen. A screenshot of a business dashboard. A screenshot of a business dashboard. A screenshot of a business dashboard.

Reporting & Dashboarding with Board

In an increasingly data-driven world, it is becoming more and more important to present information in a clear and understandable way. This is where reporting and dashboarding come into play. Reports contain important information about an organization or company, such as financial data, performance indicators, sales figures or customer feedback.
Dashboarding, on the other hand, emphasizes the visual aspect of data, bringing it together in real time and presenting it clearly. A dashboard is an interactive and intuitive way to monitor and analyze information because it shows key KPIs and trends at a glance. Dashboards in Board can be configured quickly, flexibly and intuitively to meet the needs of different departments and employees in an organization.

Effective reporting and dashboarding enables organizations to monitor, analyze, and present key data and metrics in real time. This helps to make decisions based on sound data and thus increase the success and profitability of the company.

Reporting

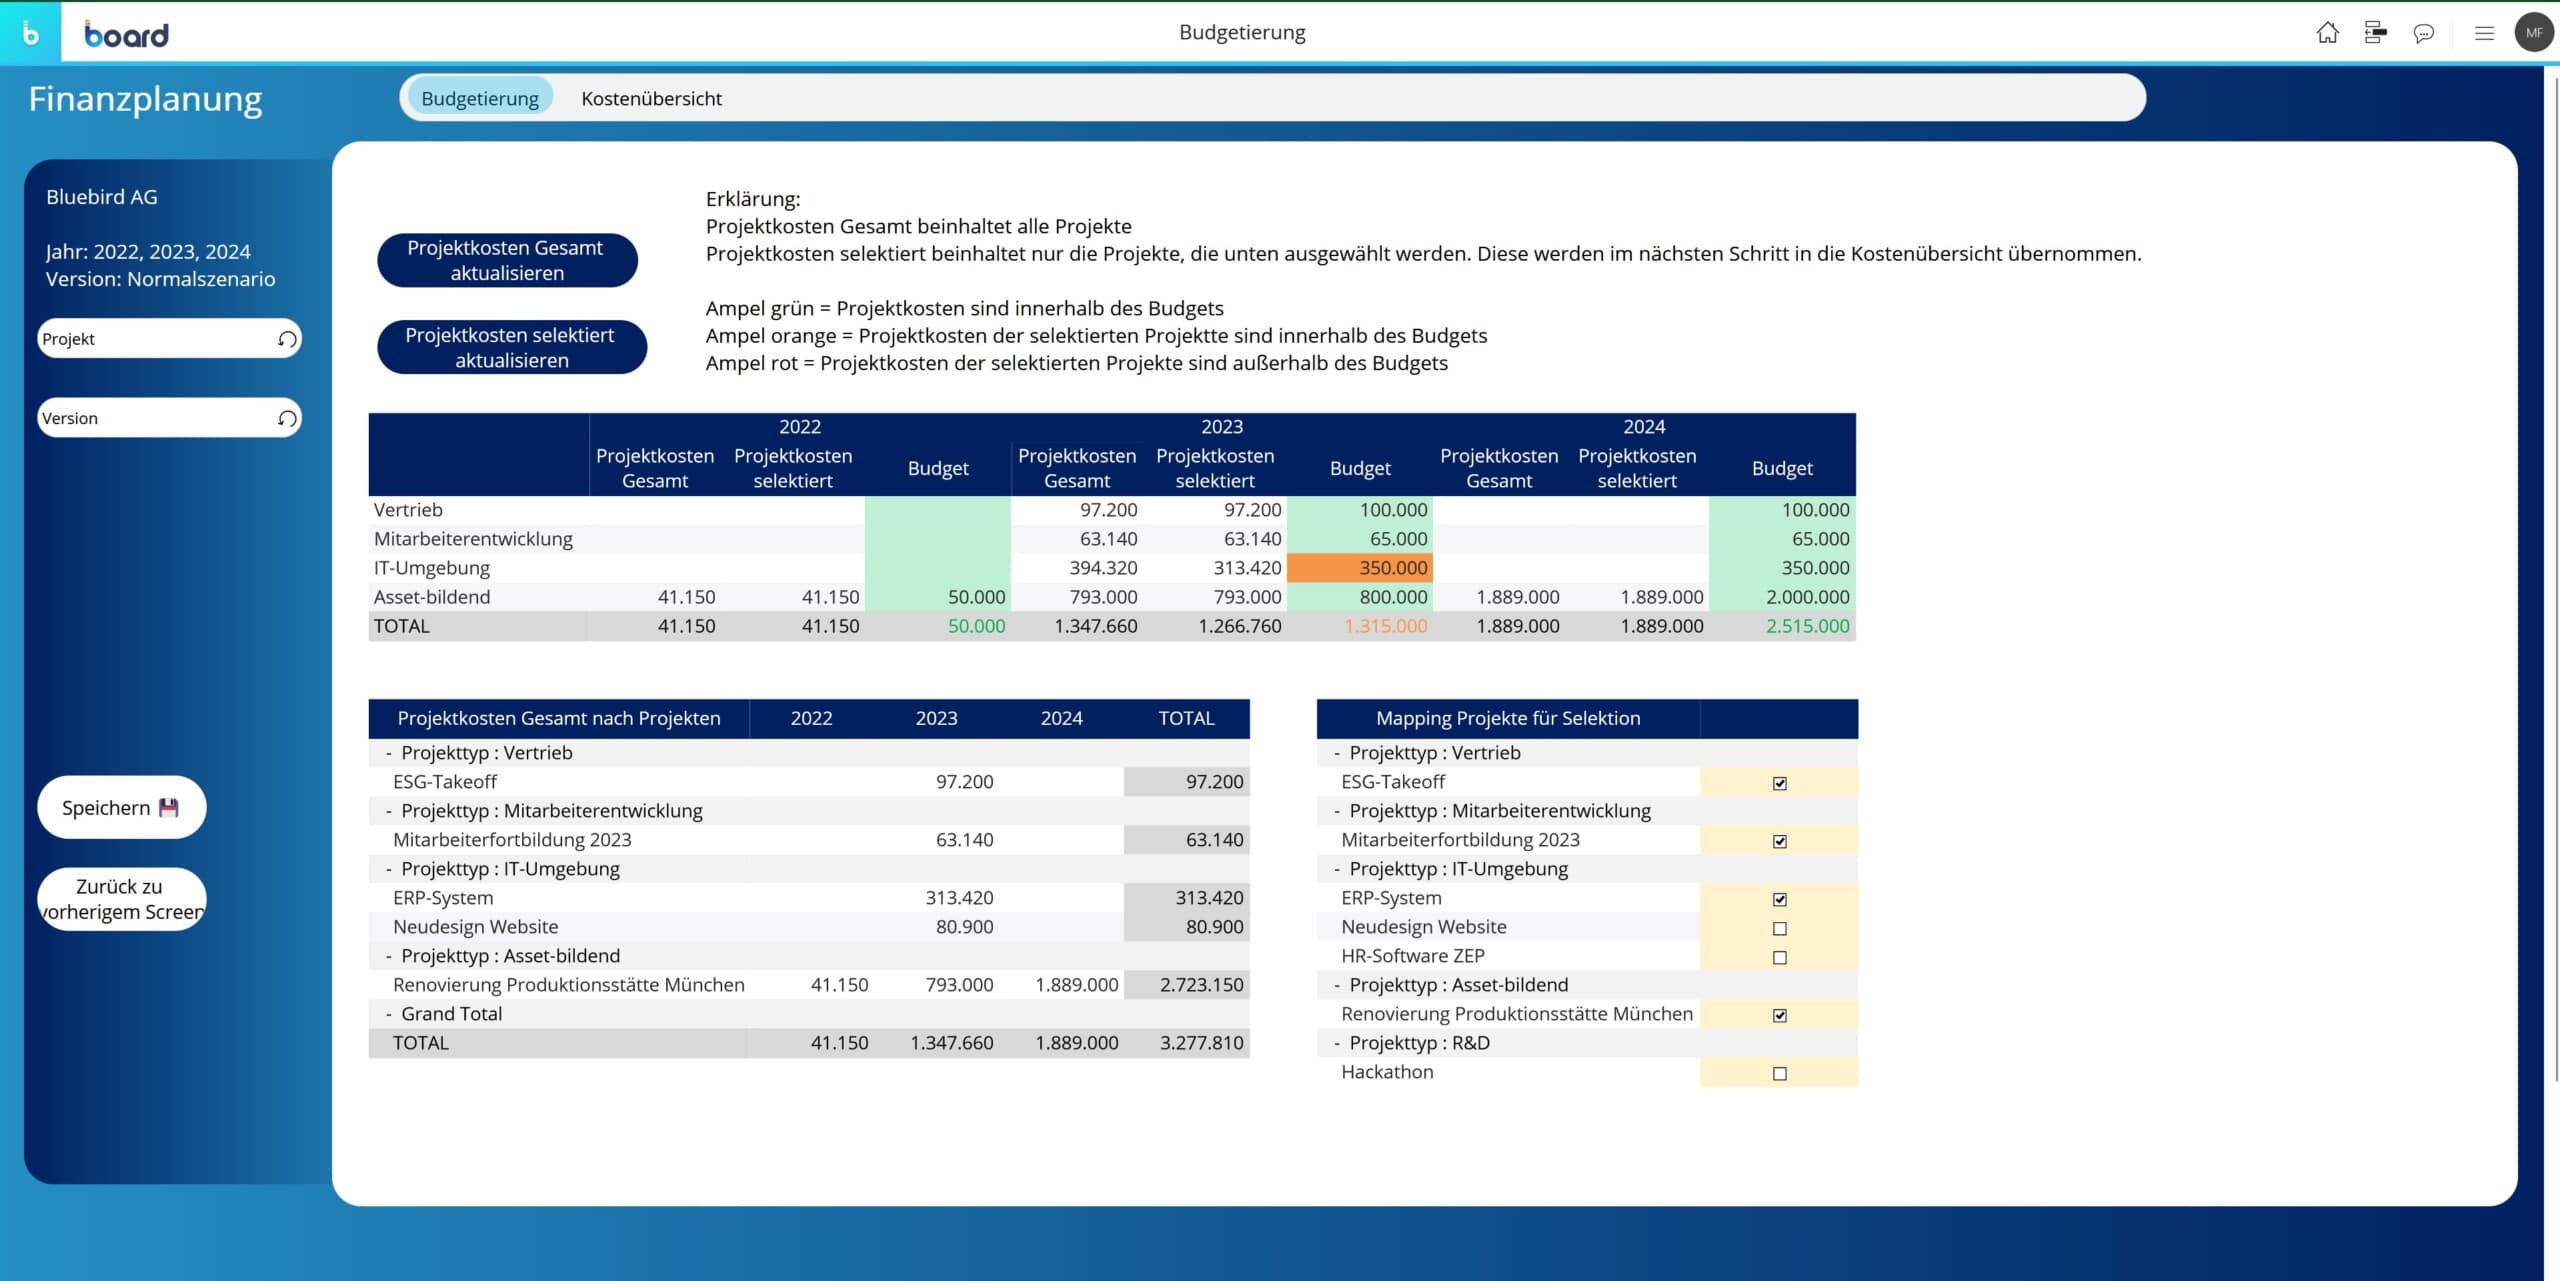
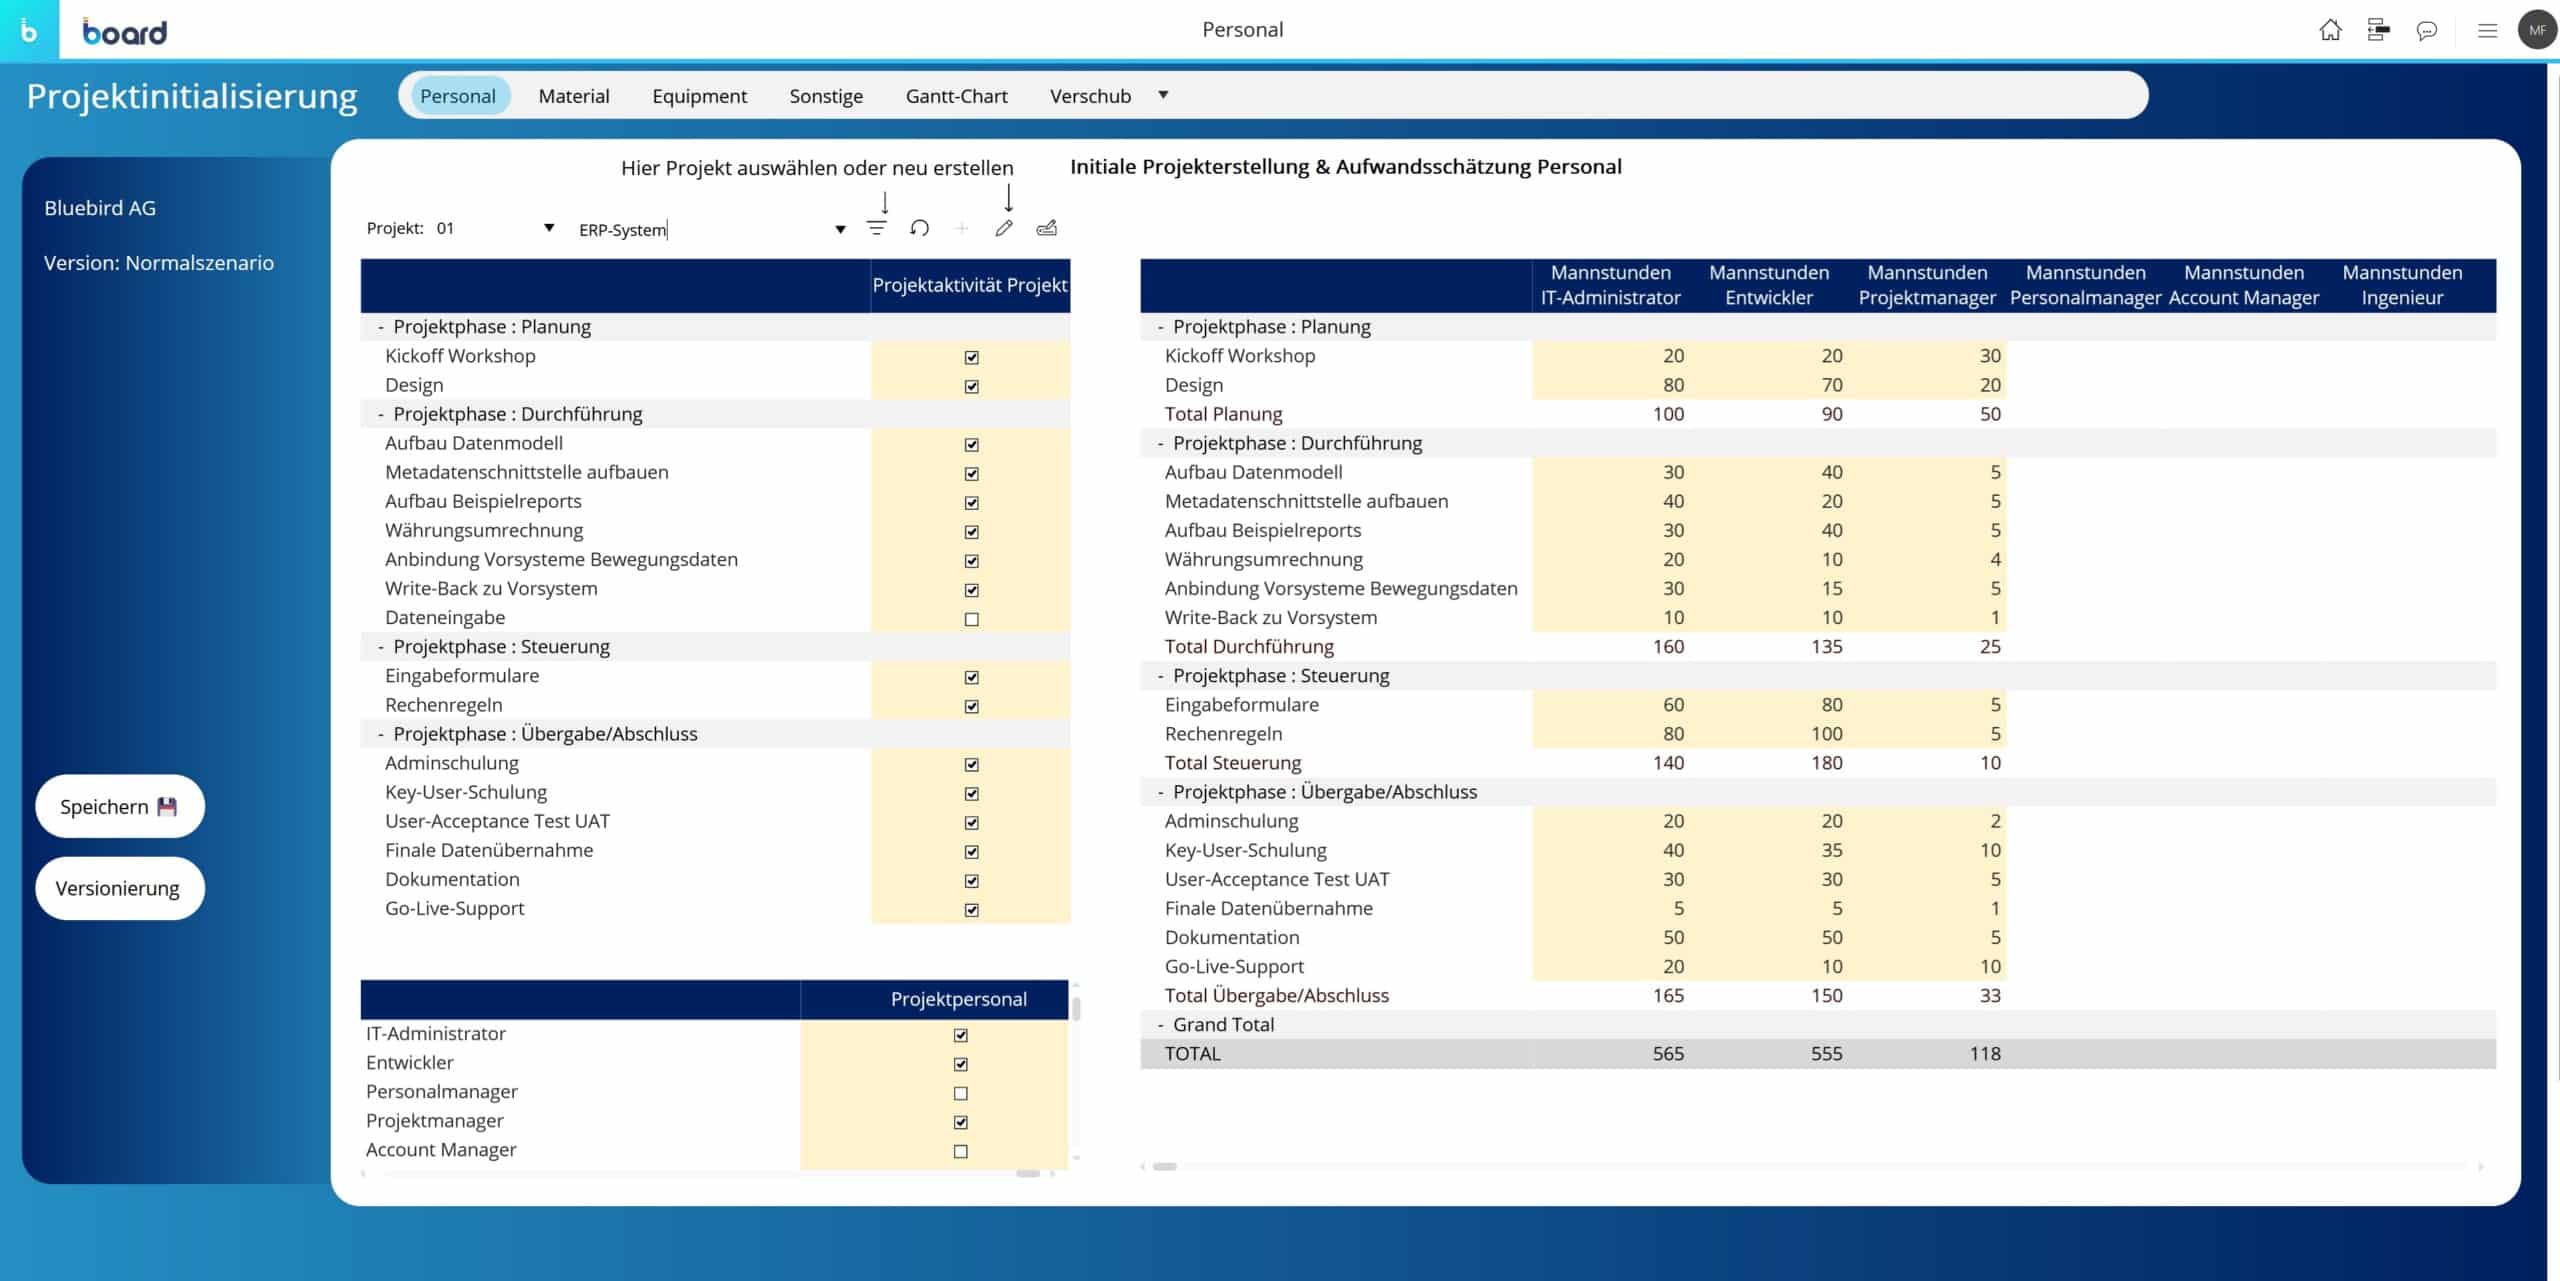
Support planning with real-time reports

Board is an advanced software solution that combines intuitive drag-and-drop functionality, a comprehensive range of charts, and seamless MS Office® integration with innovative alerting and distribution capabilities to enable effective report generation and distribution. Board’s powerful self-service user environment allows users to customize reports with the flexibility to create a consistent and shared source of information that provides immediate answers to their questions.

A screenshot of a business dashboard.

Efficient distribution of personalized and interactive reports


Board provides a powerful scheduling and distribution capability for interactive or static reports in any format that can be automatically sent to thousands of report recipients. This ensures that the right information always reaches employees, customers or partners at the right time.

Another advantage of Board is the ability to distribute reports through security roles throughout the recipient chain so that report recipients see only the information that is relevant to them. This ensures maximum security and data protection when distributing reports.

In addition, Board has a multi-language feature that ensures that the display is automatically in the language of the report recipient. In this way, companies can also operate globally and send reports in different languages to their recipients without having to perform time-consuming translations or manual adjustments.

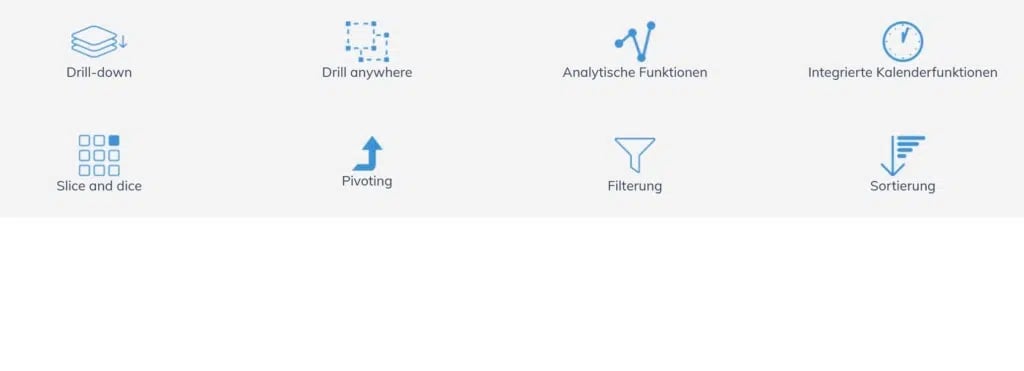
Quickly identify trends and anomalies in the detailed analysis thanks to boards standard functions
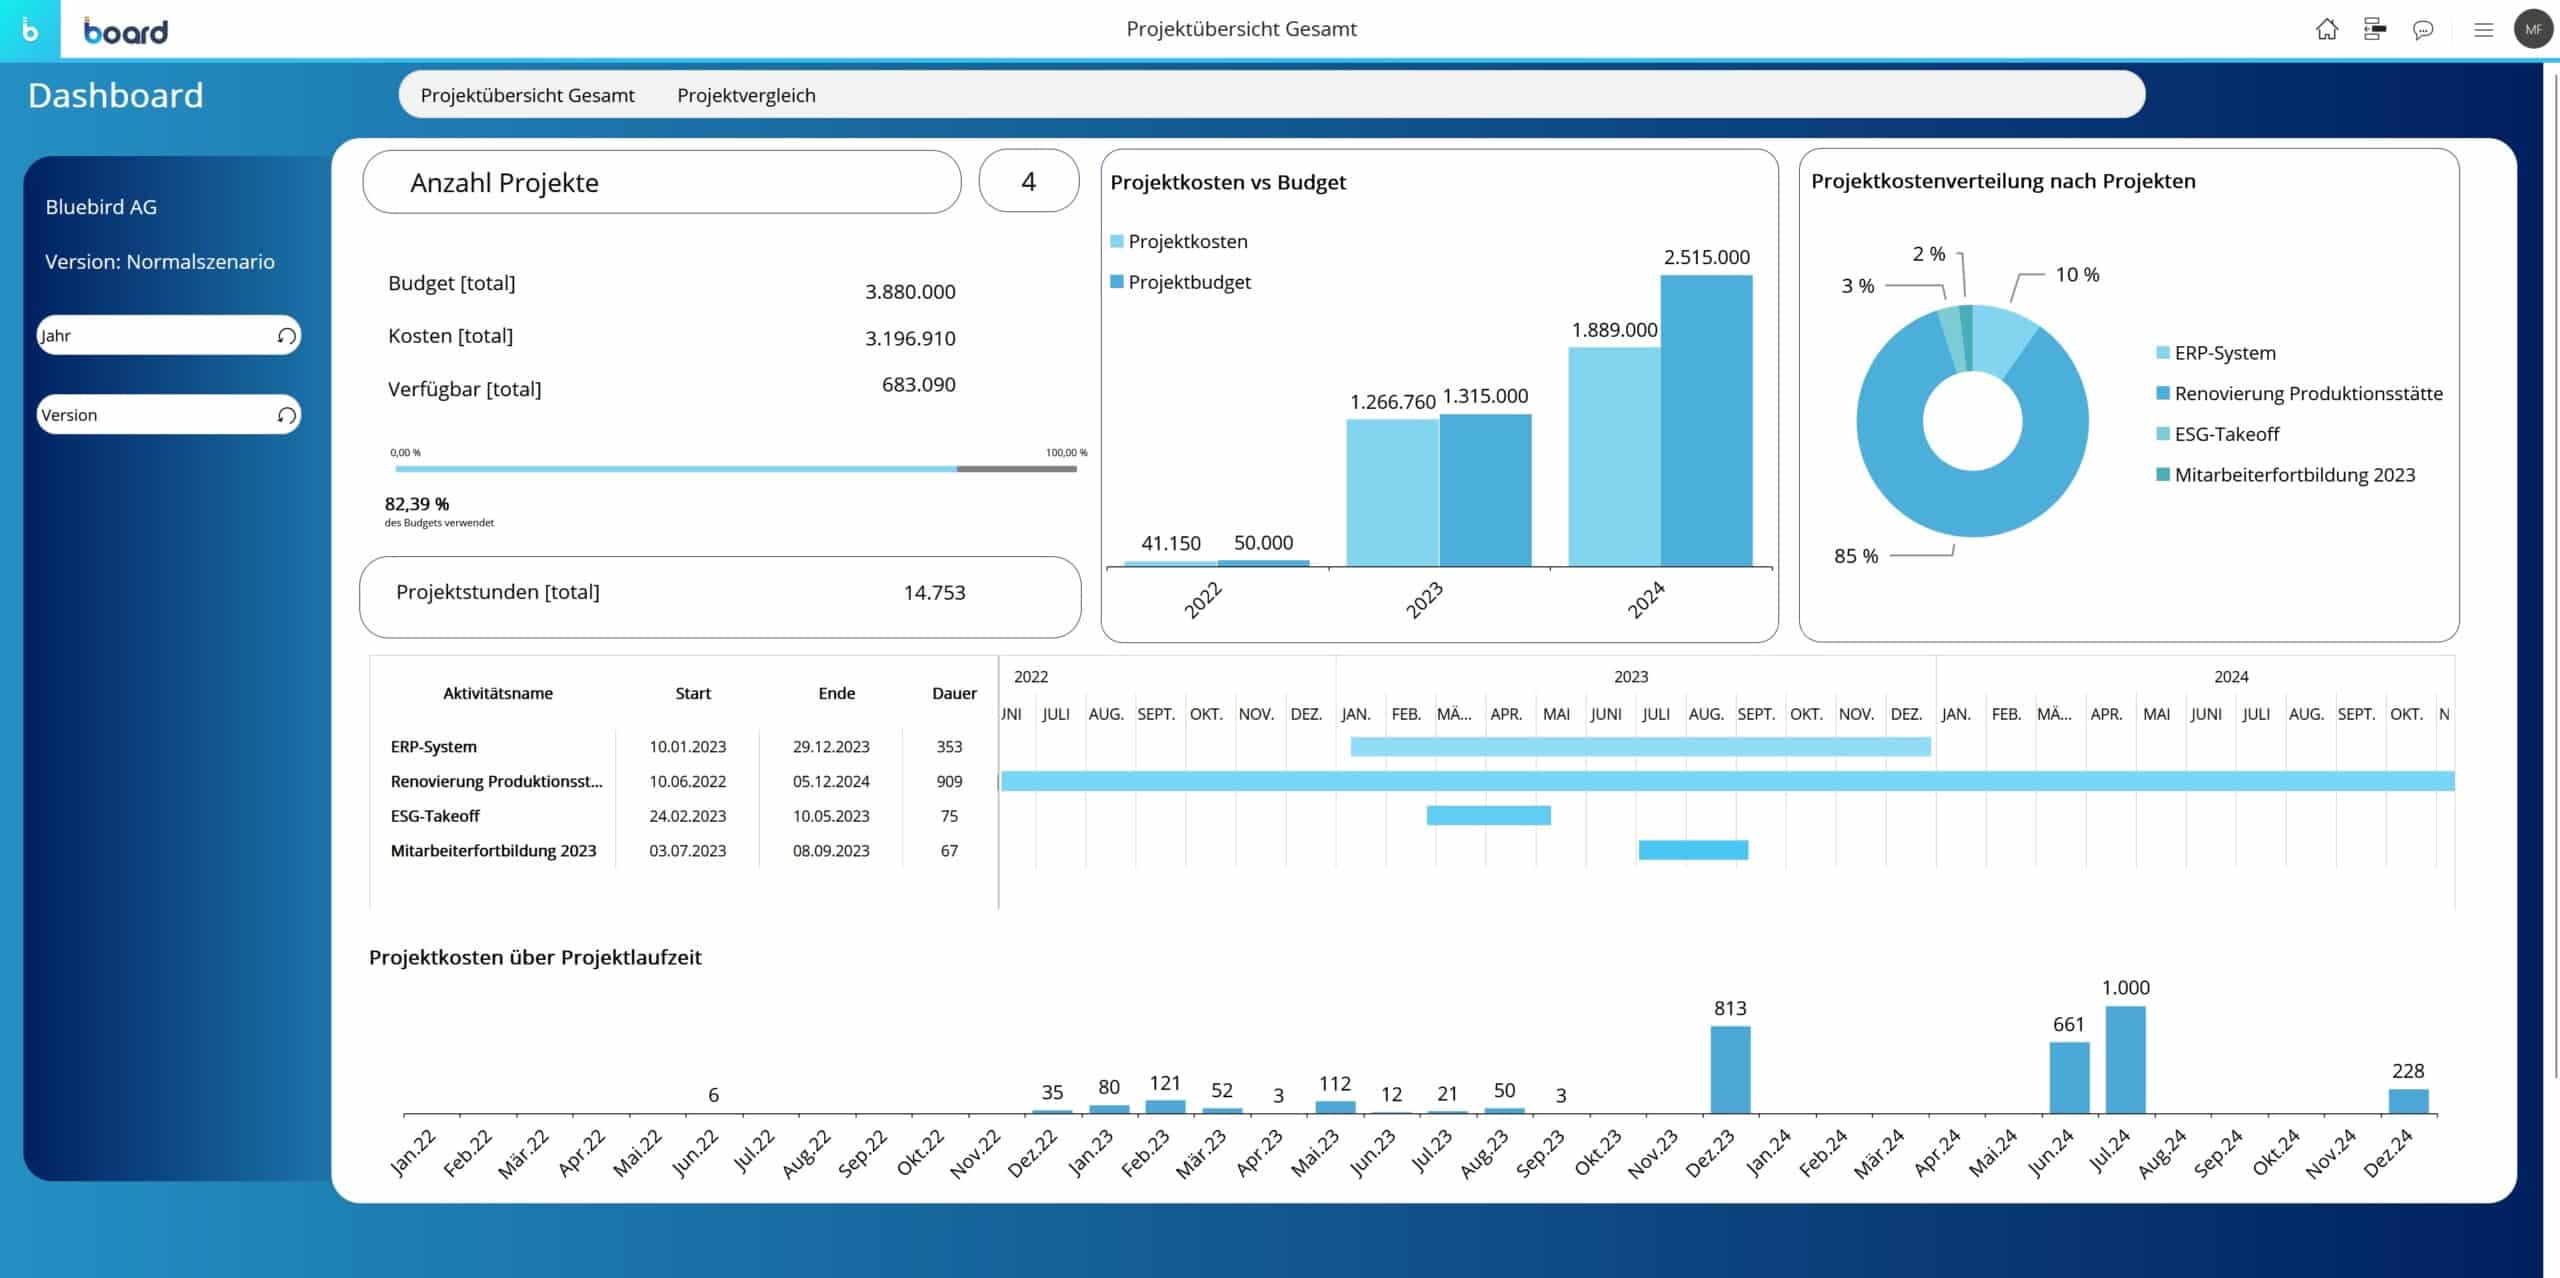
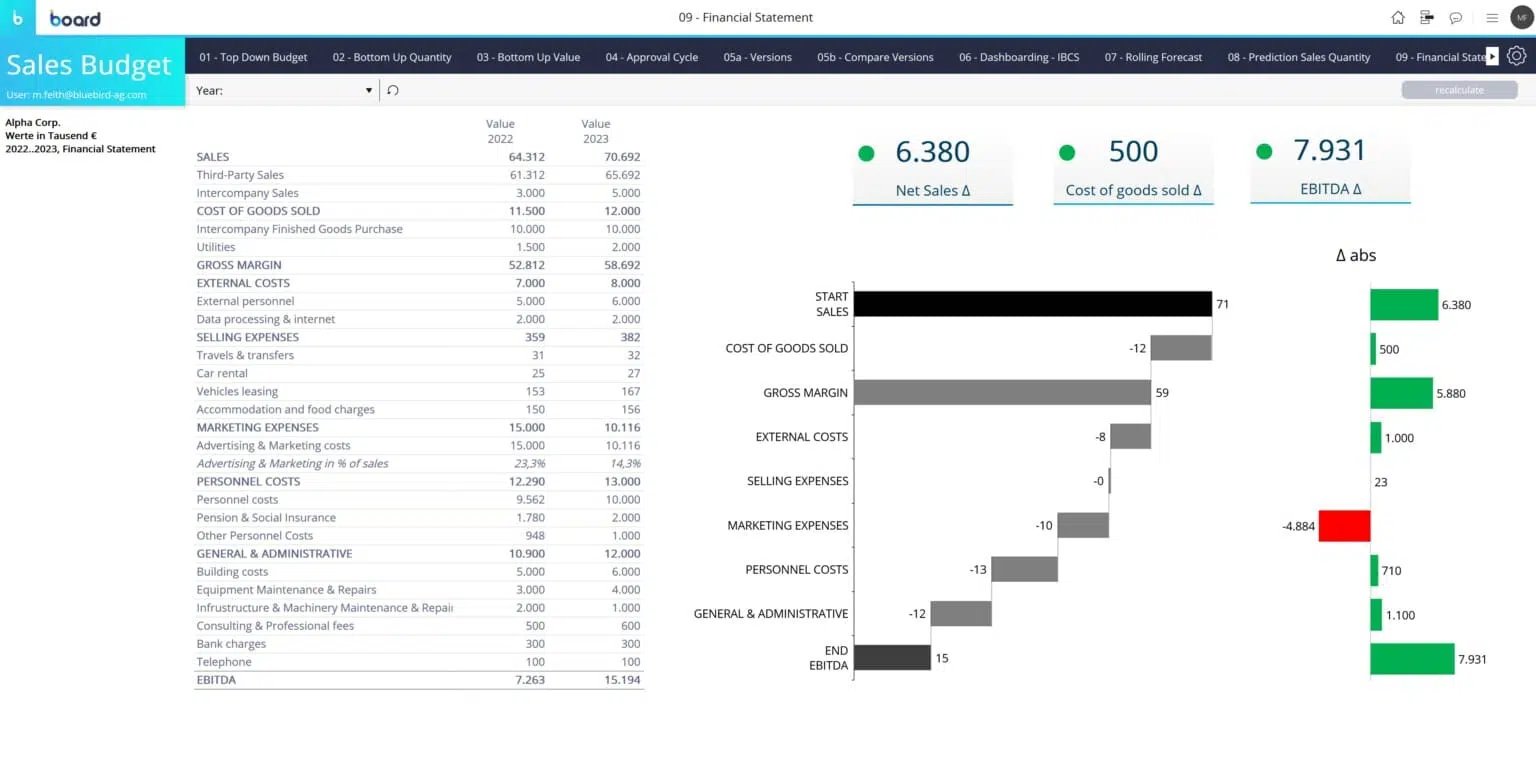
A screenshot of a mobile app with various icons on it.

Dashboarding

Quick insights through self-service analyses as a basis for the planning process

Board provides an intuitive user interface to quickly and easily create meaningful visualizations and analytics from multiple data sources – all without the assistance of IT.

The innovative platform enables self-service data preparation, search-based data discovery capabilities, custom mashups, and drag-and-drop functionality to ensure easy, fast, and efficient access to the right data for every user. In doing so, the company’s data governance is not compromised.

Board’s unified self-service analytics platform ensures that users can derive meaningful insights from data in seconds. With automatic data preparation and an easy-to-use interface, users can quickly access the information they need to make better decisions and improve business performance. Even IBCS-style solutions are no problem thanks to the wide range of technical and graphic possibilities boards.

A dashboard with a number of different charts and graphs.
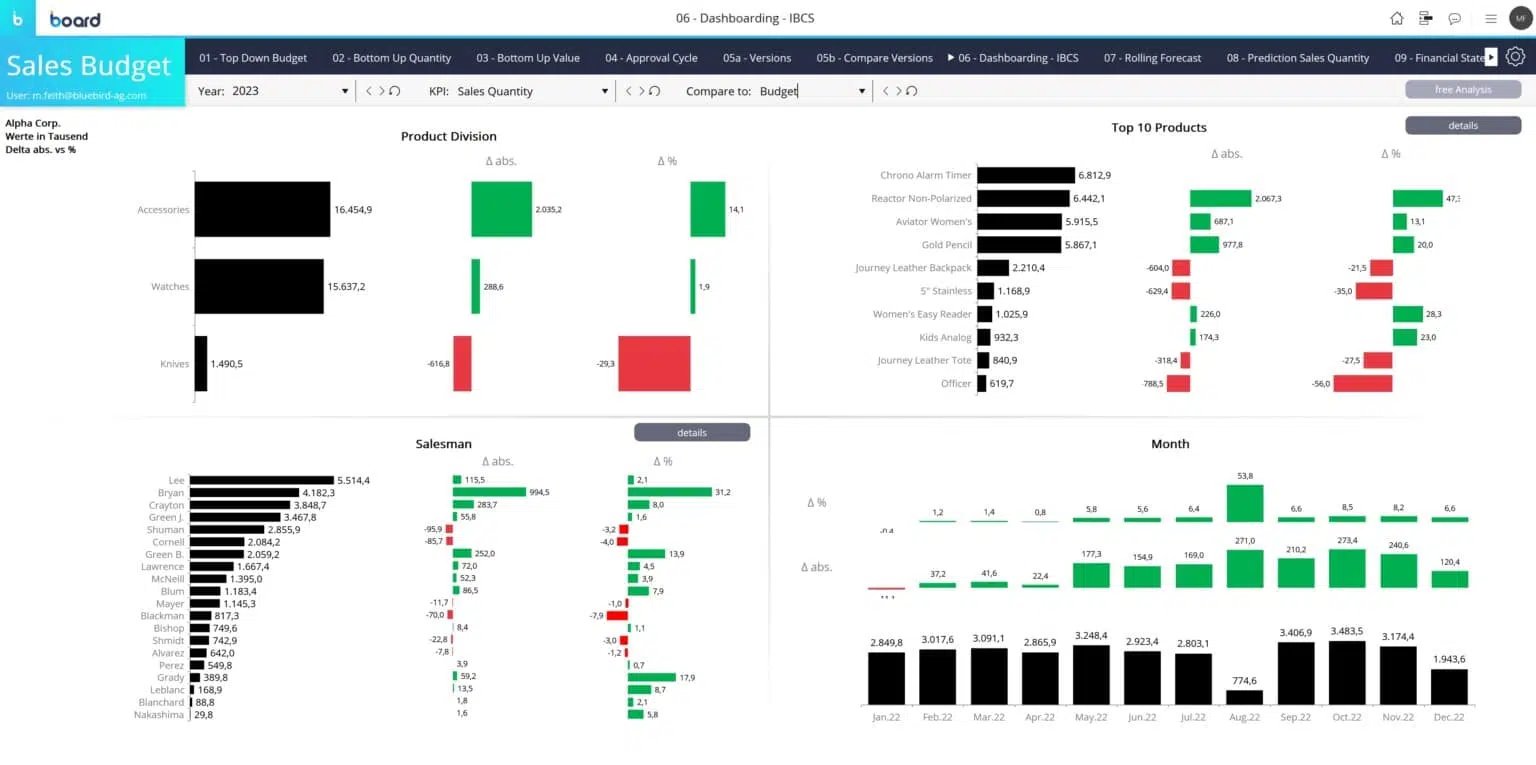
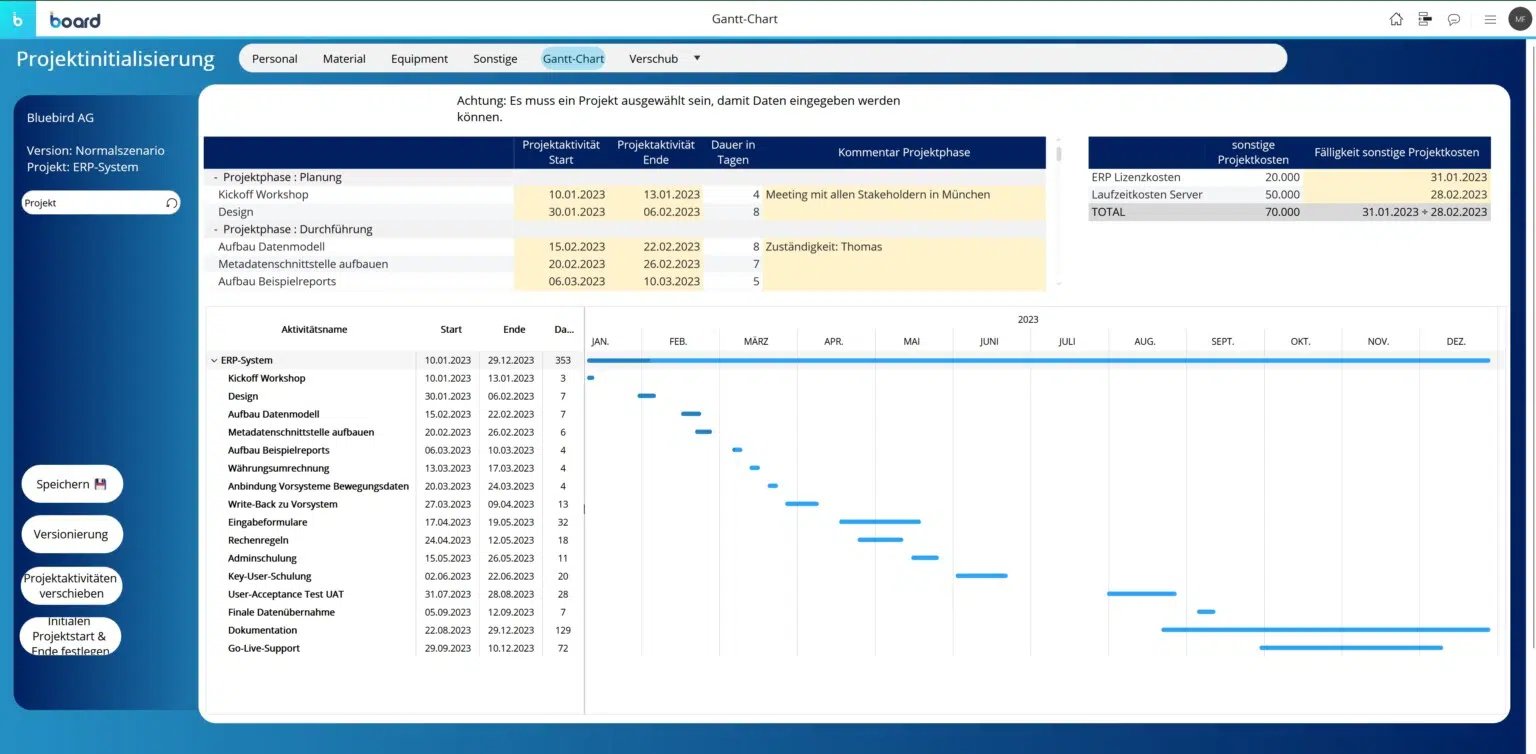
Mapping and advanced diagramming features

Board offers a wide range of advanced charts such as heat maps, Gantt charts, bubble charts and network diagrams to provide users with an understandable view of the data.

Decision makers in particular will be excited about the interactive maps that allow data to be displayed and analyzed in a spatial way. These maps provide an intuitive way to visualize and understand geographic information such as locations of stores, customers or distributors.

Board also offers advanced visualization options such as network node diagrams and scatterplots to show more complex data relationships. Board’s advanced charts thus provide a comprehensive range of visualization capabilities to help users analyze data quickly and effectively.

A screenshot of a project management dashboard.

We at Bluebird help you to achieve your goals and are always at your side with our professional know-how as well as with our technical expertise.

We look forward to hearing from you.

Contact

Please fill out the following registration form and we will contact you shortly!

Never share confidential information (credit card numbers, national insurance numbers, passwords) through this form.

This website is protected by reCAPTCHA and Google's privacy policy and terms of use apply.

Are you looking for something different?

Find more leading CPM providers here: